The R Shiny technology makes it possible to design so-called data visualization applications, which offer users possibilities to interact on the display of data. At SBIM, this technology is used in different types of applications:
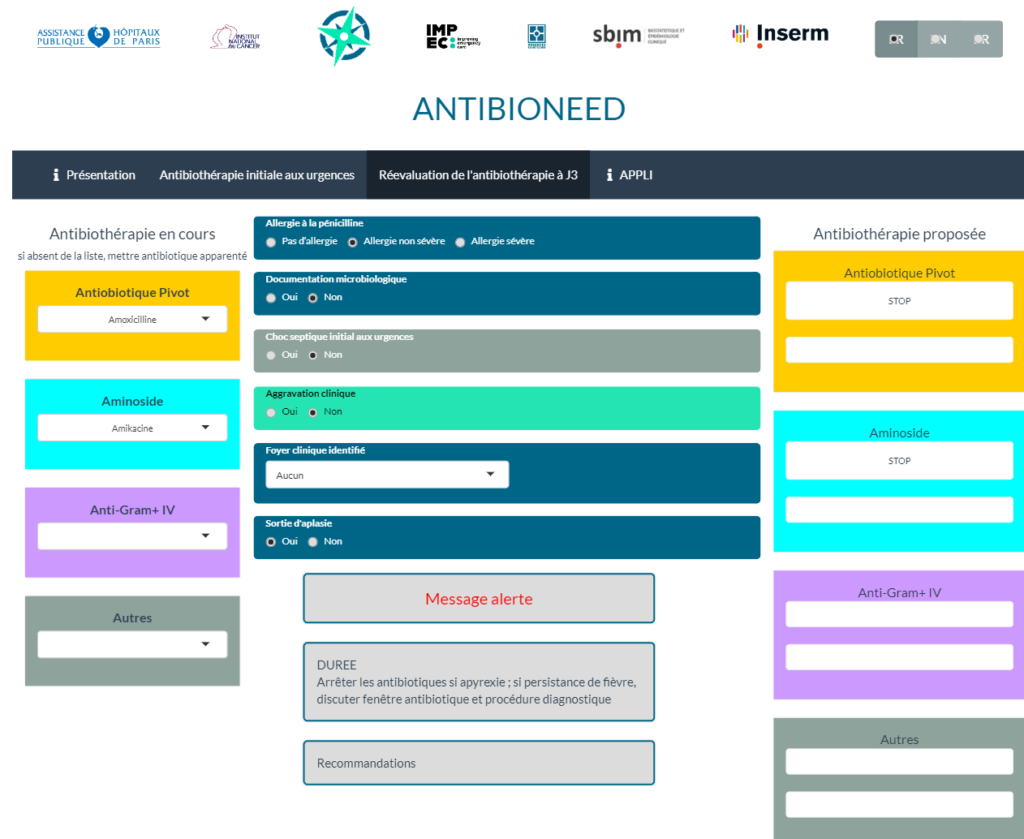
Applications that make an algorithm result simple or complex, calculated from users’ interactive responses: Antiobioneed
Application of visualization enriched with medical data for experts: CADASIL cohort
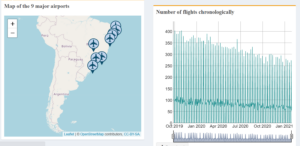
Proof-of-concept applications: air flight and Covid correlation in Brazil: Emma Lafaurie -Internship